
See what your offers really drive with Pareto
Your quantity break offers might be live, but are they actually moving the needle on your bottom line? In the world of e-commerce, a discount that doesn’t increase your basket size is just a margin killer.
We’ve fully reimagined the Pareto Quantity Breaks – Statistics page to change that. This isn’t just a fresh coat of paint; it’s a high-precision toolkit designed to help you stop guessing and start scaling your most profitable campaigns.
The Headline: Real-Time AOV Lift
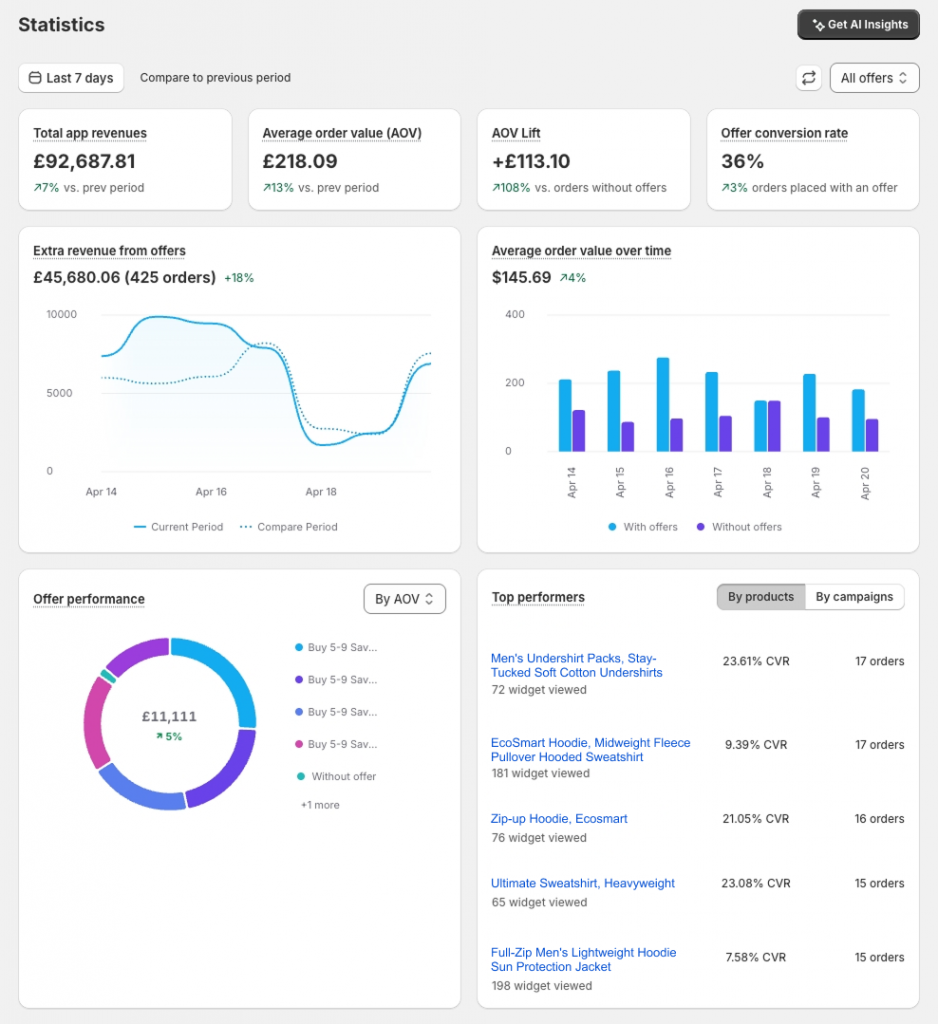
The most important question for any merchant is: “Are my offers actually making people spend more?” Our upgraded dashboard now explicitly calculates your AOV Lift. By splitting your data into two clear streams—orders with Pareto offers and orders without—you can see the exact impact on your Average Order Value.
How we calculate your success:
Using the new AOV metrics, you can visualize your performance through this formula:
AOV Lift = AOVwith offers – AOVwithout offers
If your “with offers” bar is significantly higher than your baseline, your strategy is working. If not, it’s time to tweak your tiers.
Deep-Dive: The Shopper Journey Funnel
Understanding that a customer didn’t buy is easy; understanding where they left is the hard part. The new Offers Conversion Funnel tracks unique shopper sessions through four critical stages:
- Widget Viewed: Did the customer actually see the offer?
- Engaged: Did they interact with the widget (change quantities or select variants)?
- Added to Cart: Did the offer provide enough value to trigger an “Add to Cart” action?
- Purchases: The ultimate goal—how many sessions resulted in a completed Pareto-discounted order?
Pro Tip: If your “Widget Viewed” is high but “Engaged” is low, your discount might not be aggressive enough. If “Engaged” is high but “Added to Cart” is low, there might be a friction point in your cart page logic.
AI-Powered Insights (Professional Plan+)
Data is great, but actions are better. For our Professional and Enterprise users, we’ve integrated an AI-powered Assistant.
Instead of spending hours cross-referencing spreadsheets, our AI analyzes your trends automatically. It identifies “hidden” revenue opportunities and provides next-best actions – like which low-performing campaigns to cut and which winning strategies to double down on.
The new Statistics page is live in your Pareto dashboard right now. It’s time to move beyond simple “revenue tracking” and start mastering your store’s growth.
Need help reading the charts? Whether you’re looking to optimize a specific campaign or just want to understand your funnel better, our team is standing by 24/7 in the live chat!
👉 Explore Statistics Now
Quickly understand what’s working, what’s not, and where more revenue is hiding.
Try Pareto on Shopify